Key Takeaways
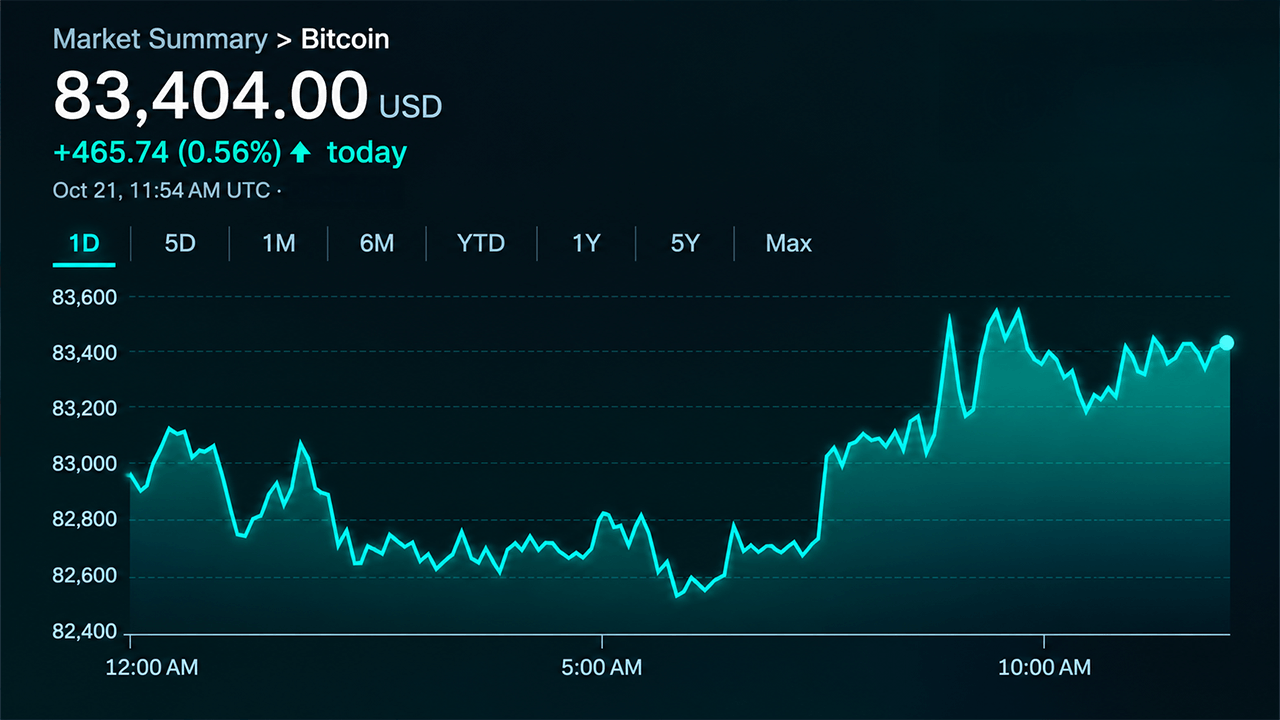
- Bitcoin’s price trades at $83,394, with $83,600 emerging as the next critical resistance threshold.
- Bitcoin’s technical readings show 13 bullish moving averages, but eight oscillators remain neutral.
- Bitcoin faces downside support at $82,500 and $82,000 if its latest recovery loses momentum.
Bitcoin Buyers Challenge $83,600 as Moving Averages Turn Bullish
Bitcoin’s price is attempting to turn a modest recovery into something more convincing, trading at $83,394 on Oct. 21 after reclaiming the $83,000 threshold and establishing higher lows across shorter timeframes.
The latest technical readings offer an intriguing contradiction: 13 moving averages favor buyers, yet most oscillators remain neutral, leaving the market with a constructive underlying structure but limited confirmation of sustained momentum. With resistance concentrated between $83,600 and $84,000, the next meaningful test will determine whether bitcoin’s rebound gains traction or encounters another round of selling pressure.
Hourly Chart Shows Improving Momentum
Bitcoin’s one-hour price chart reveals a recovery from $81,102, with buyers progressively reclaiming $82,500 and $83,000 before pushing toward $83,600. The advance has established a sequence of higher lows, suggesting that near-term demand has improved following the earlier retreat.
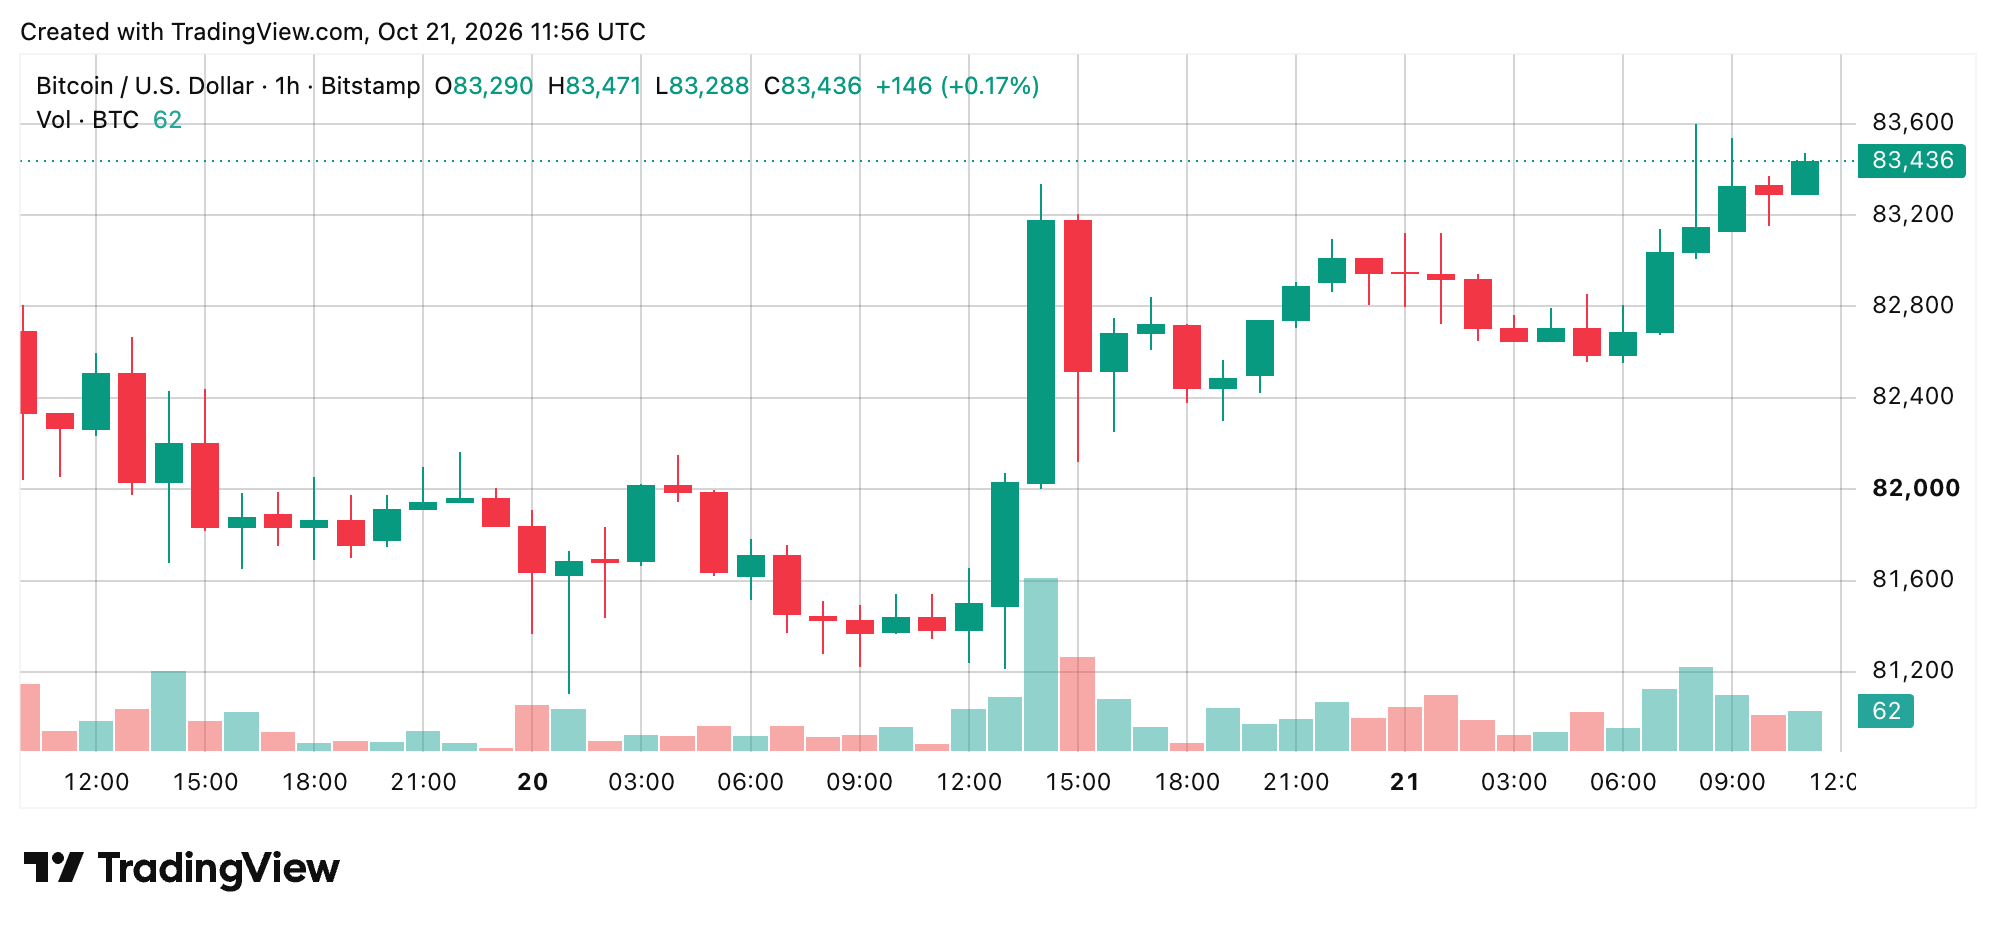
However, price action has since consolidated around $83,400, while comparatively modest volume on the latest candles suggests buyers have yet to demonstrate overwhelming conviction. A break above $83,600 would strengthen the short-term bullish argument, whereas a retreat beneath $83,000 would place the developing recovery under renewed scrutiny.
Four-Hour Recovery Faces Its Next Obstacle
The four-hour chart presents a more constructive picture, with bitcoin’s price rebounding from $79,694 and gradually establishing higher lows as buyers regain control of important price levels. Reclaiming $82,500 and $83,000 has improved the intermediate technical structure, although resistance at $83,600 continues to obstruct further progress.
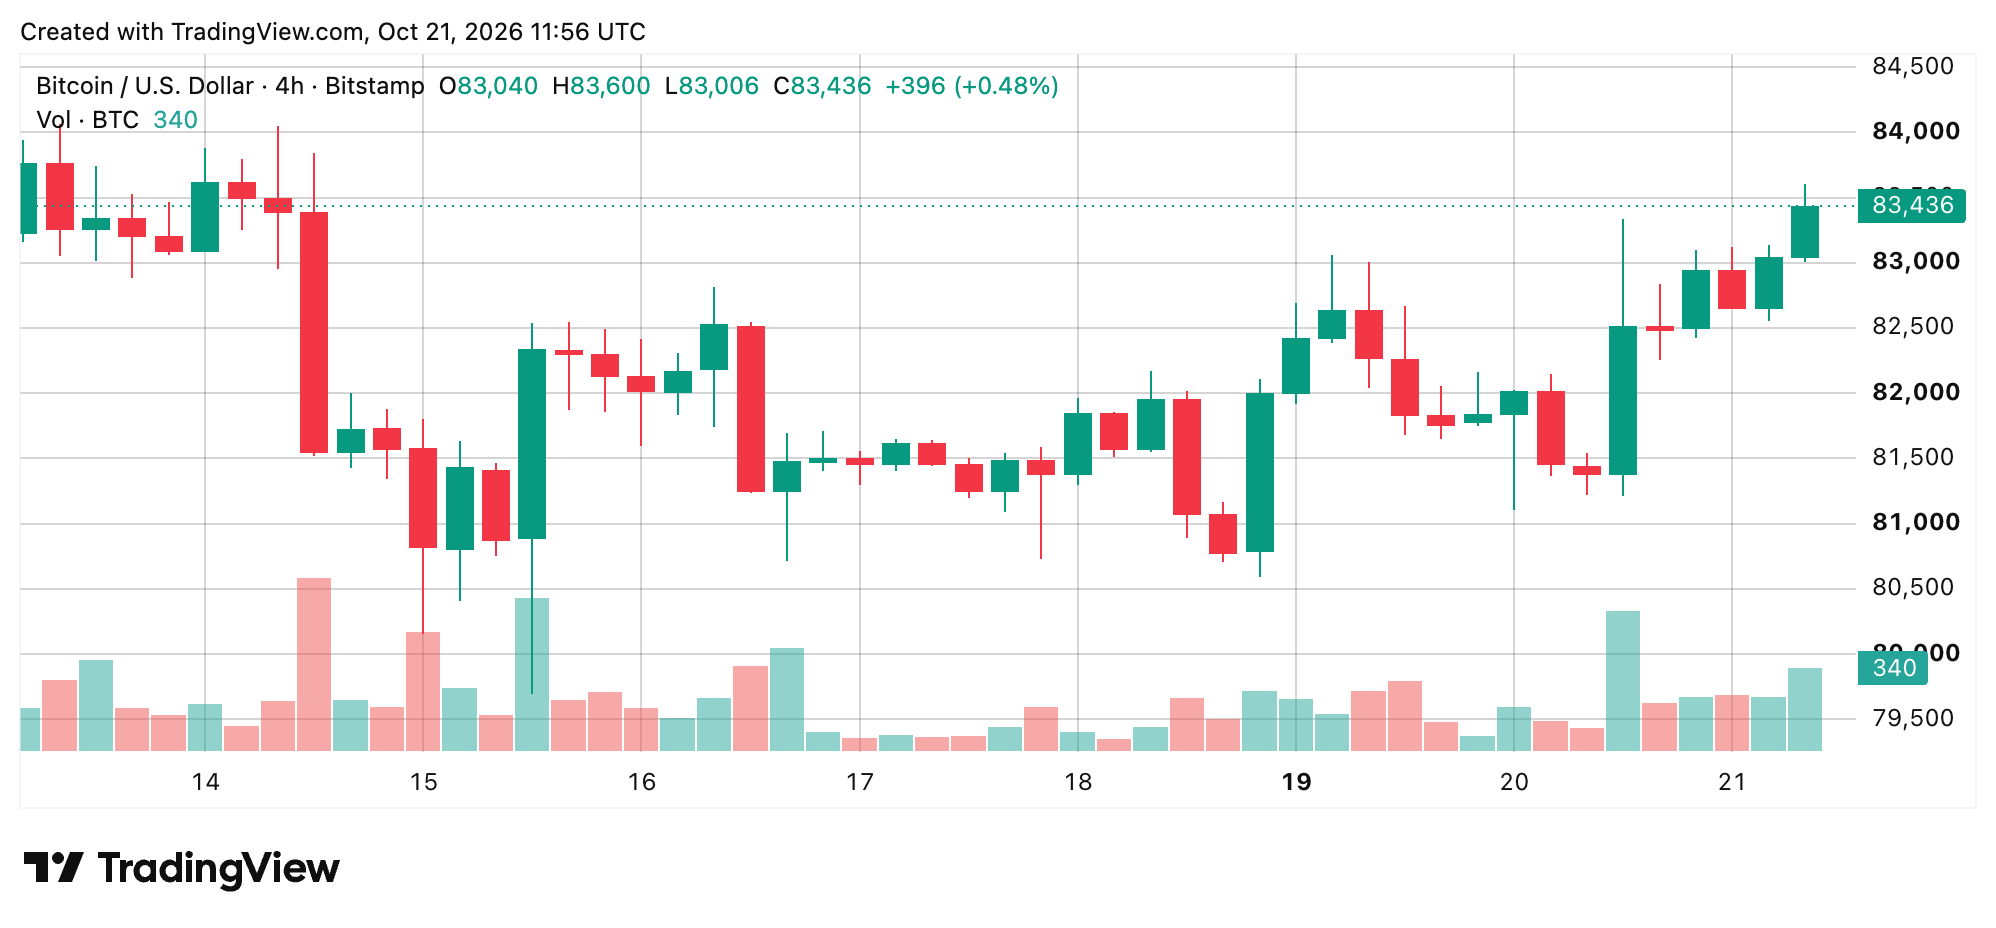
A convincing breakout accompanied by stronger participation would expose $84,000 and subsequently $84,500. Conversely, failure to defend $82,500 would weaken the bullish formation and raise the possibility of another test of the $82,000 region.
Daily Structure Remains Caught in Consolidation
Bitcoin’s daily price chart offers a more restrained interpretation of the recovery, showing improving price action following its earlier decline toward $80,000 but little evidence of a confirmed broader reversal. Higher daily lows suggest selling pressure has moderated, although the $84,000 to $85,000 resistance region continues to limit the market’s upside potential.
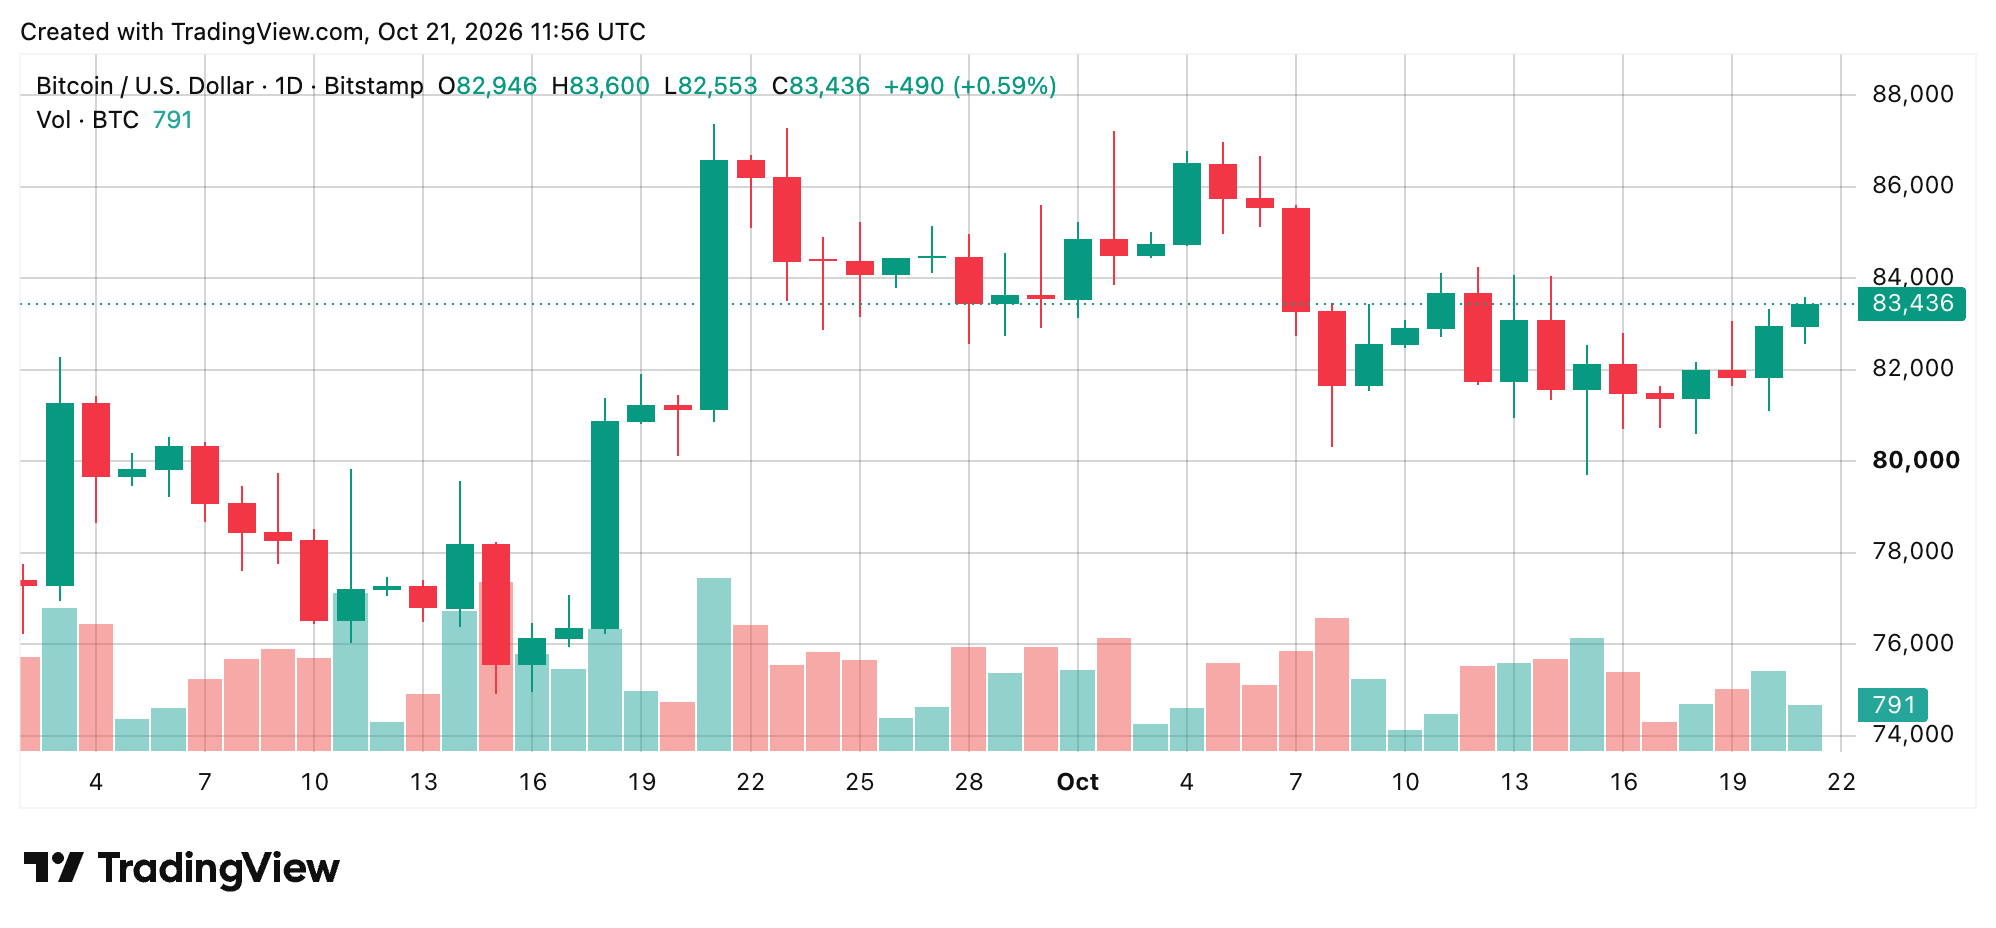
A sustained daily close above $84,000 would provide stronger evidence that buyers are gaining ground. Until that happens, the recovery remains part of a wider consolidation, with $82,000 serving as an important downside reference.
Oscillators Hesitate as Moving Averages Favor Buyers
The daily chart’s oscillator readings on Wednesday reflect this uncertainty, with eight neutral signals, two bearish readings, and one bullish indication. The relative strength index (RSI) stands at 54, while the stochastic oscillator registers 55, both consistent with a market lacking extreme directional momentum.
The average directional index (ADX) at 19 further suggests that trend strength remains limited. Meanwhile, the moving average convergence divergence (MACD) level of 109 carries a bearish classification, alongside momentum at negative 346. Bull bear power, however, remains positive at 995, indicating that buyers haven’t entirely surrendered their advantage.
The mid-week moving averages (MAs) tell a distinctly more optimistic story, with 13 bullish readings against one bearish and one neutral. Bitcoin trades above its 10-period exponential moving average (EMA) at $82,519, 20-period exponential moving average (EMA) at $82,613, and 50-period simple moving average (SMA) at $81,687. However, the 30-period simple moving average (SMA) at $83,540 remains overhead, reinforcing nearby resistance.
| 🟢 Bull Verdict | 🔴 Bear Verdict |
| A decisive breakout above $83,600 would strengthen bitcoin’s bullish structure, opening the door to $84,000 and potentially $84,500. Sustained trading above $83,000, supported by expanding volume and continued higher lows, would reinforce buyer confidence and improve the prospects of challenging the broader $85,000 resistance region. | Failure to overcome $83,600 could invite renewed selling pressure toward $82,500 and $82,000. A decisive breakdown beneath $81,100 would undermine the recovery, exposing $80,500 and potentially $79,694. Weakening volume, fading momentum and persistent resistance near $84,000 would further strengthen the bearish argument. |