
Solana price fell 1.4% on Sept. 7 after another rejection near $107, while weakening capital flows and nearby liquidation clusters increased the risk of further volatility.
Summary
- Solana price fell from $106.46 to $104.97 after sellers defended the $107 resistance zone.
- SOL remains above its 20-, 50-, 100-, and 200-period averages on the 4-hour chart.
- Chaikin Money Flow dropped to -0.15, pointing to increased selling pressure.
- Liquidation liquidity is concentrated near $108, with another notable cluster around $103.
Solana price retreats after $107 rejection
According to data from crypto.news, Solana (SOL) price traded lower on Sept. 7 as buyers failed to push the token through a resistance cluster between $106.80 and $107.50.
SOL opened the daily session at $106.46 and rose to an intraday high of $106.80 before reversing. The token subsequently fell as low as $104.22 and closed at $104.97, representing a 1.4% daily decline.
The move kept Solana near the psychological $105 level, which now separates a renewed test of recent highs from a deeper pullback toward its short-term moving averages.
Price action on the 4-hour chart shows that SOL has entered a period of consolidation after a strong rally from around $75 in mid-August. The token reached approximately $110 on Aug. 28 before losing momentum and falling toward $98 at the start of September.
Buyers defended that correction and drove SOL back above $106, but repeated failures around $107 suggest that sellers remain active below the August peak.
Trading activity also appeared to weaken during the latest advance. Reduced participation makes it more difficult for buyers to absorb sell orders and can produce sharper moves around leveraged positions.
SOL remains above key moving averages
Despite the daily decline, Solana continues to trade above all four moving averages shown on the 4-hour chart.
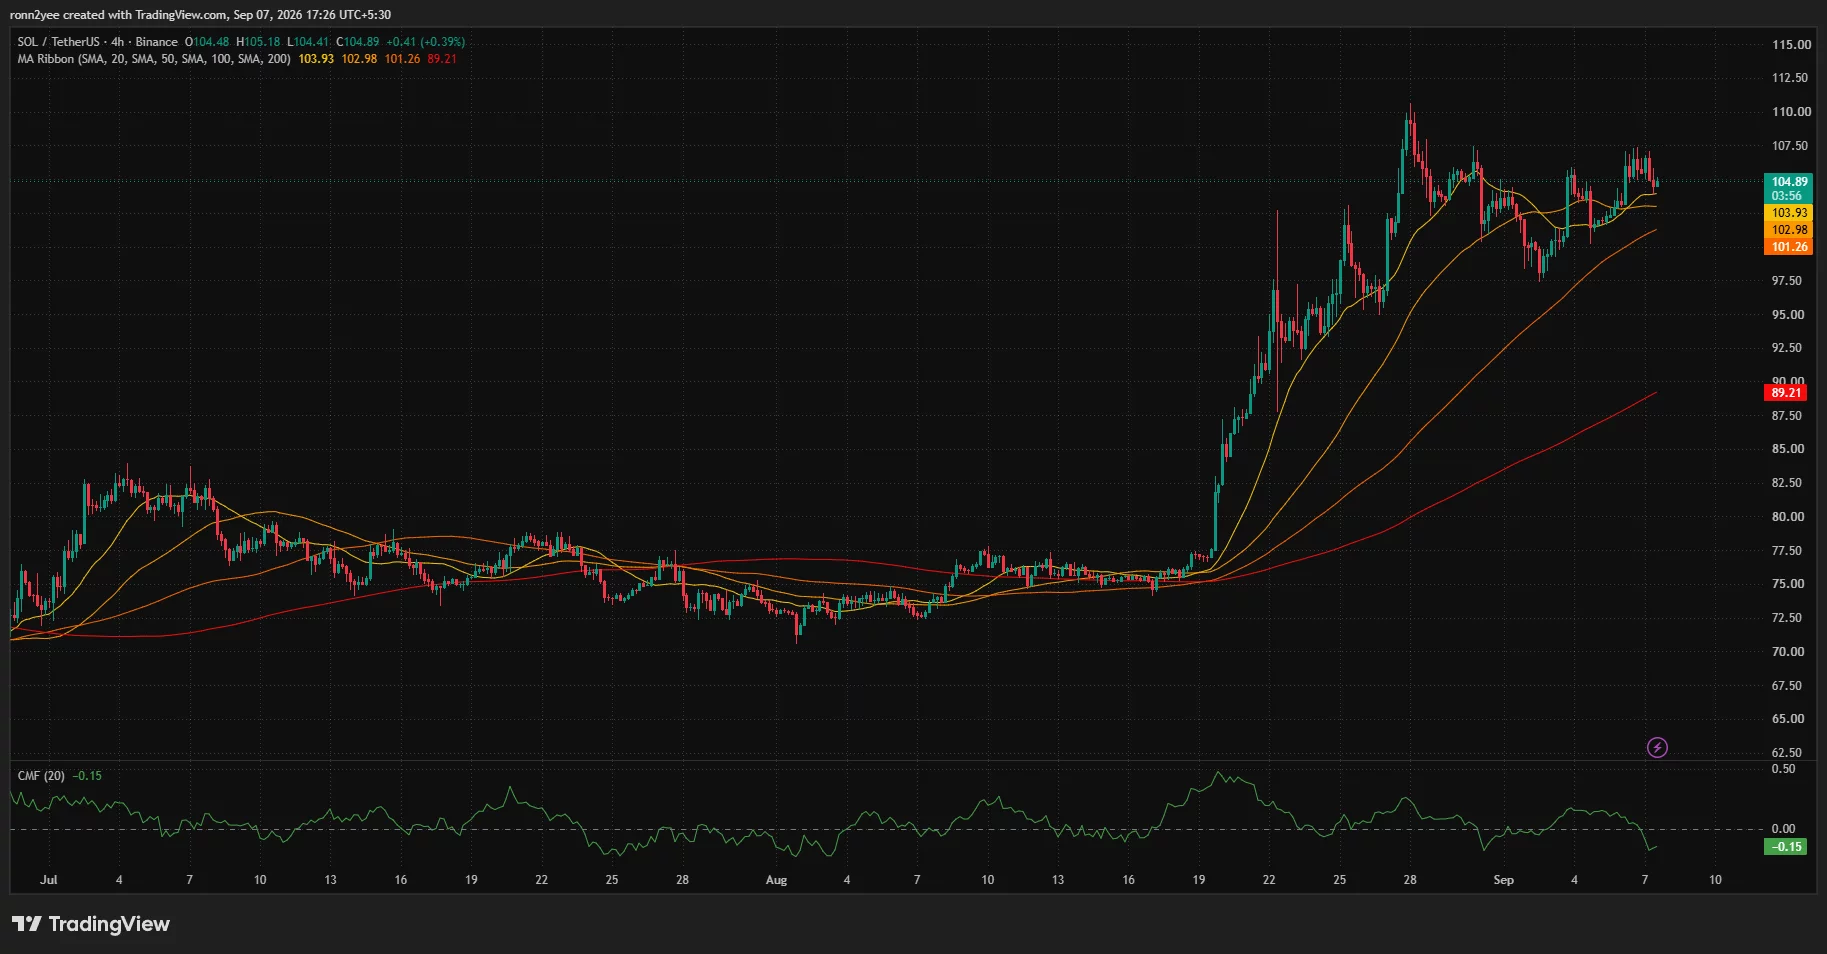
The 20-period simple moving average stands at $103.93, while the 50-period average sits slightly lower at $102.98. Those levels form the first important support area between $103 and $104.
SOL’s 100-period moving average is positioned at $101.26. A decisive 4-hour close below that level would weaken the current recovery structure and expose the psychological $100 mark.
The broader trend remains strong while Solana holds above its 200-period moving average at $89.21. A wide gap between the market price and that longer-term average reflects the scale of the rally that began in August, although it also leaves room for a larger correction if short-term support fails.
Moving-average alignment remains bullish because the shorter averages are positioned above the longer ones. However, Chaikin Money Flow has fallen to -0.15, showing that selling pressure has exceeded buying pressure over the indicator’s measurement period.
Negative CMF readings do not confirm an immediate breakdown, but the divergence between price and capital flows suggests that the latest rebound lacks strong spot-market support.
Liquidation map puts $108 and $103 in focus
CoinGlass’ 24-hour liquidation heatmap shows the largest nearby concentration of leveraged positions around $108.
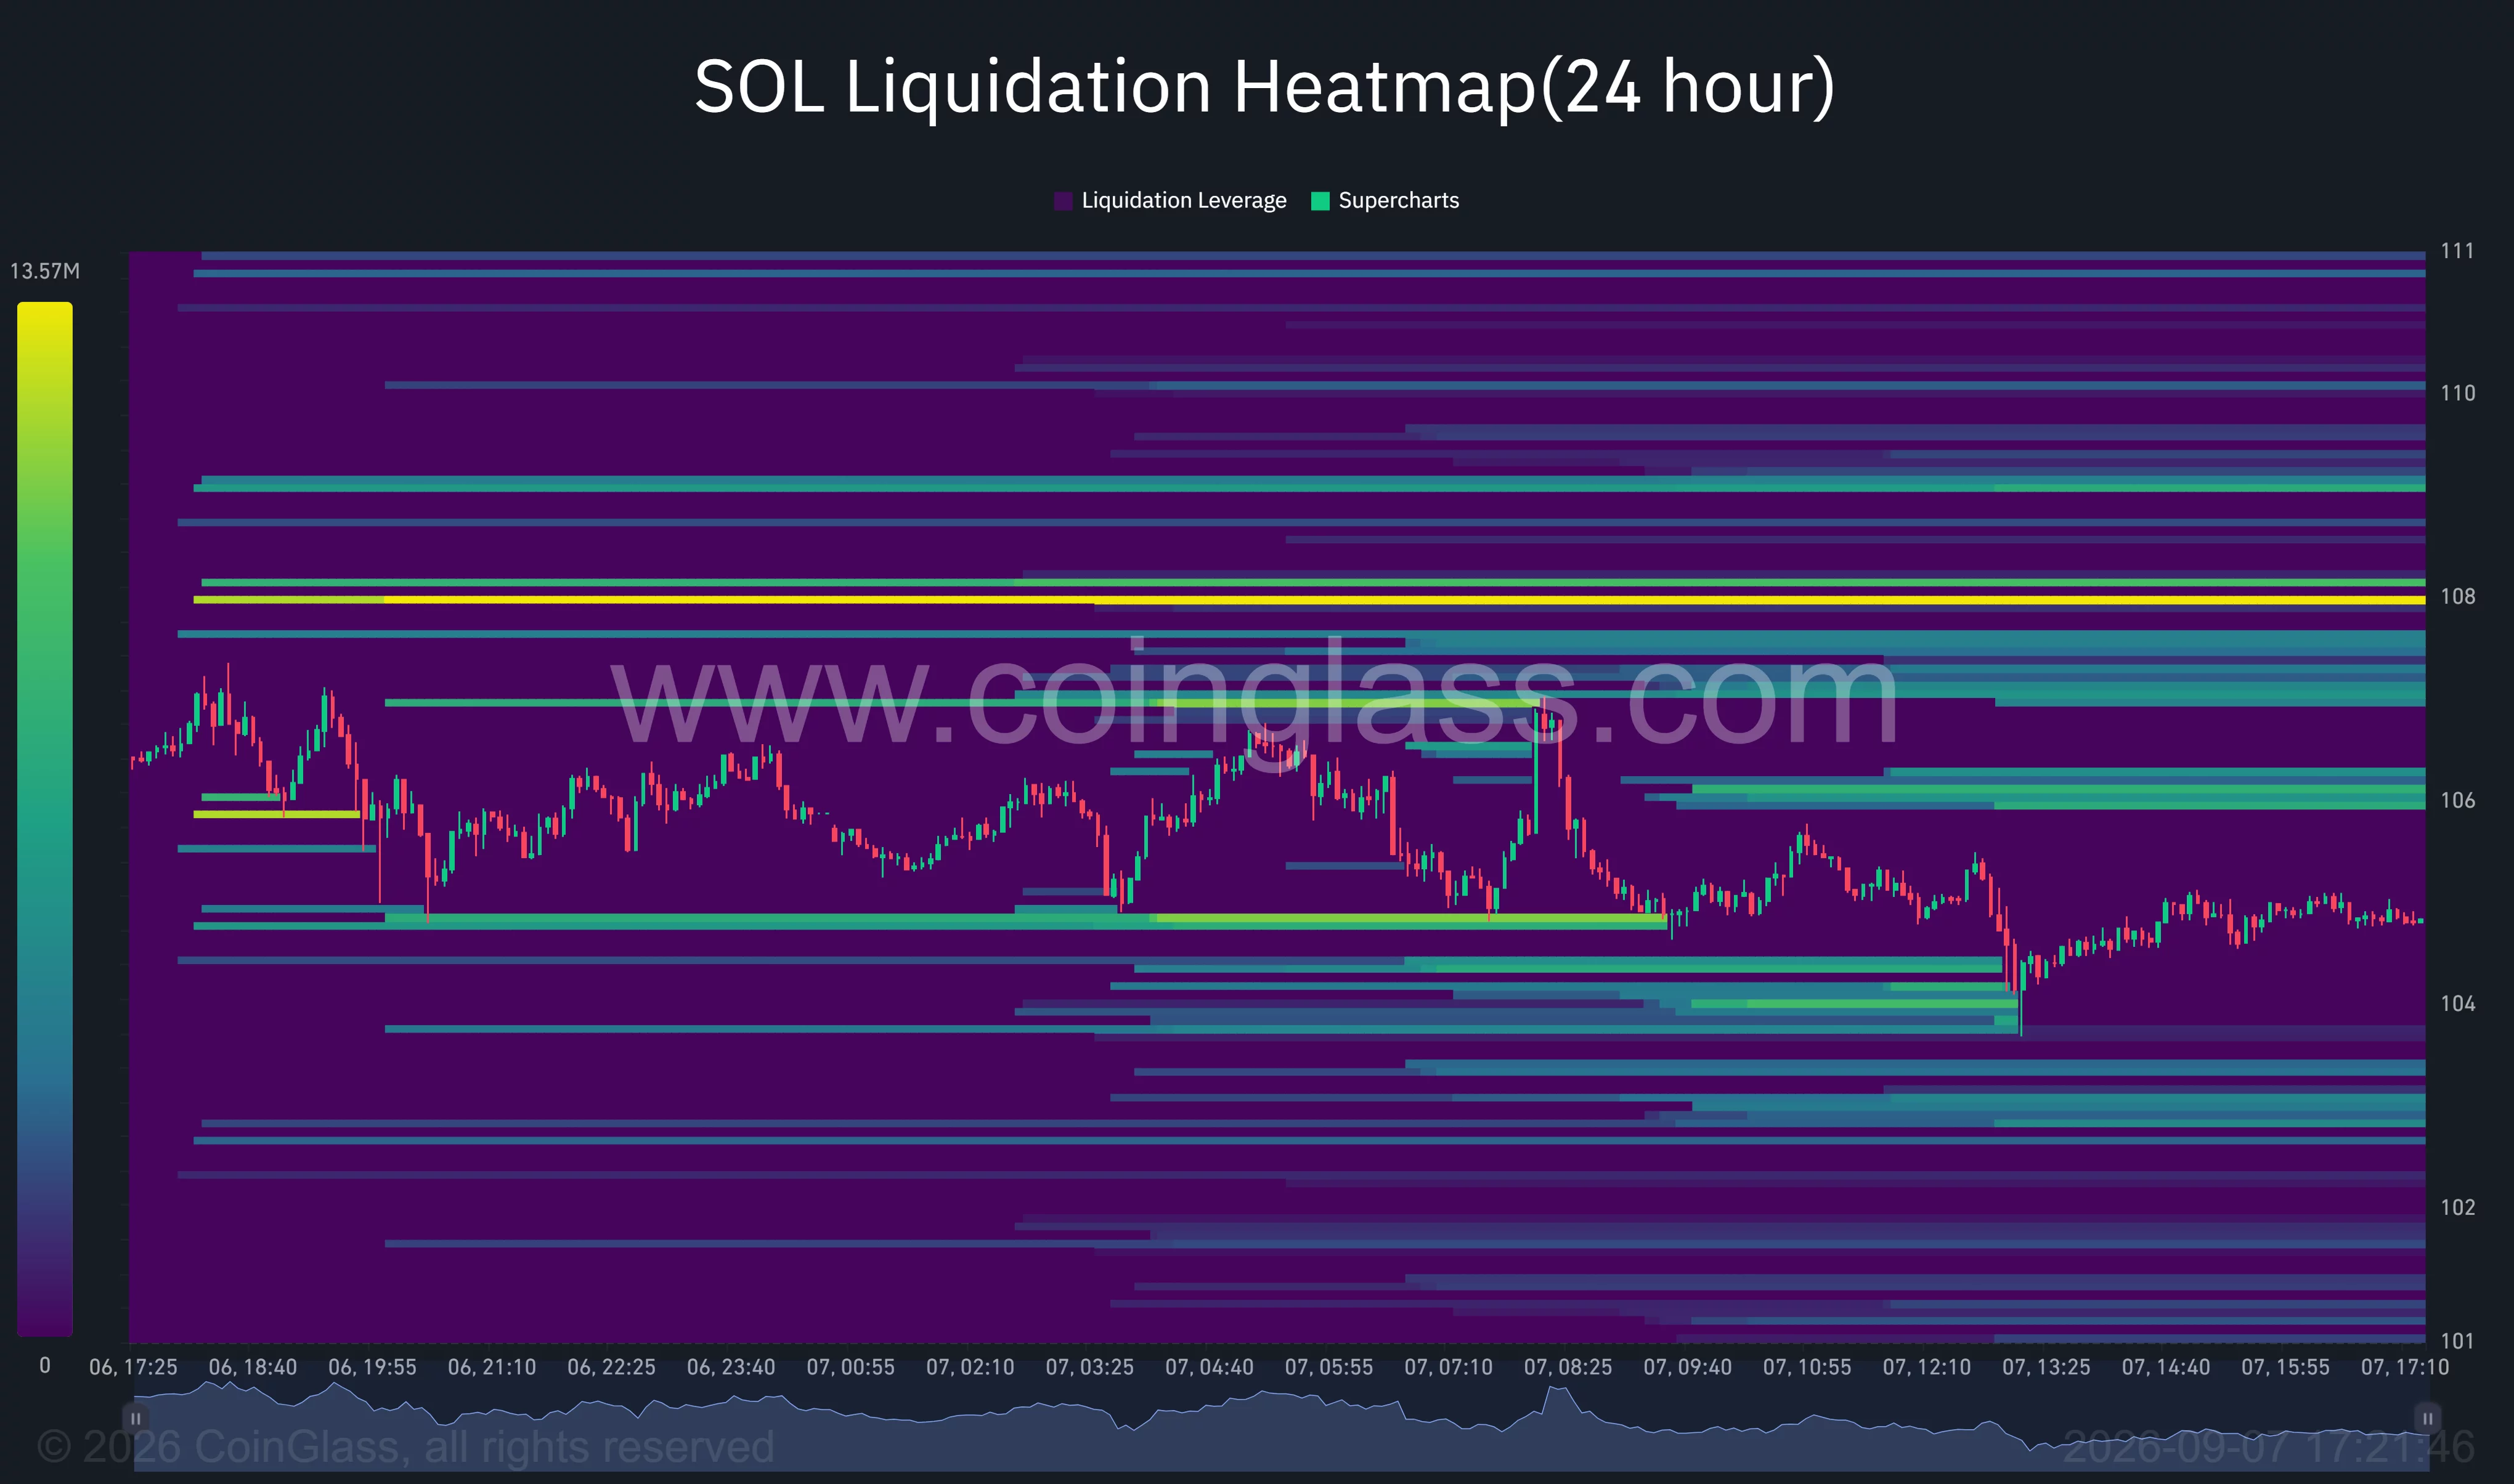
The bright liquidity band at that level could attract price if SOL recovers above $106 and breaks through the $107 resistance area. Such a move could force short sellers to close positions, potentially accelerating an advance toward $109 and the recent peak near $110.
Additional overhead liquidity appears around $108.80, $109.50, and $110. A sustained breakout above $110 would establish a higher high and support an extension of the August rally.
Downside liquidity is more dispersed. The closest notable clusters appear between $103 and $104, followed by another concentration around $102.50. A break below $104 could therefore trigger long liquidations and pull SOL toward the $102.98–$103.93 moving-average zone.
The $101.26 average would become the next technical defense if that area fails. Below it, $100 represents both a psychological level and the approximate base of Solana’s latest rebound.
Daily signals show momentum is cooling
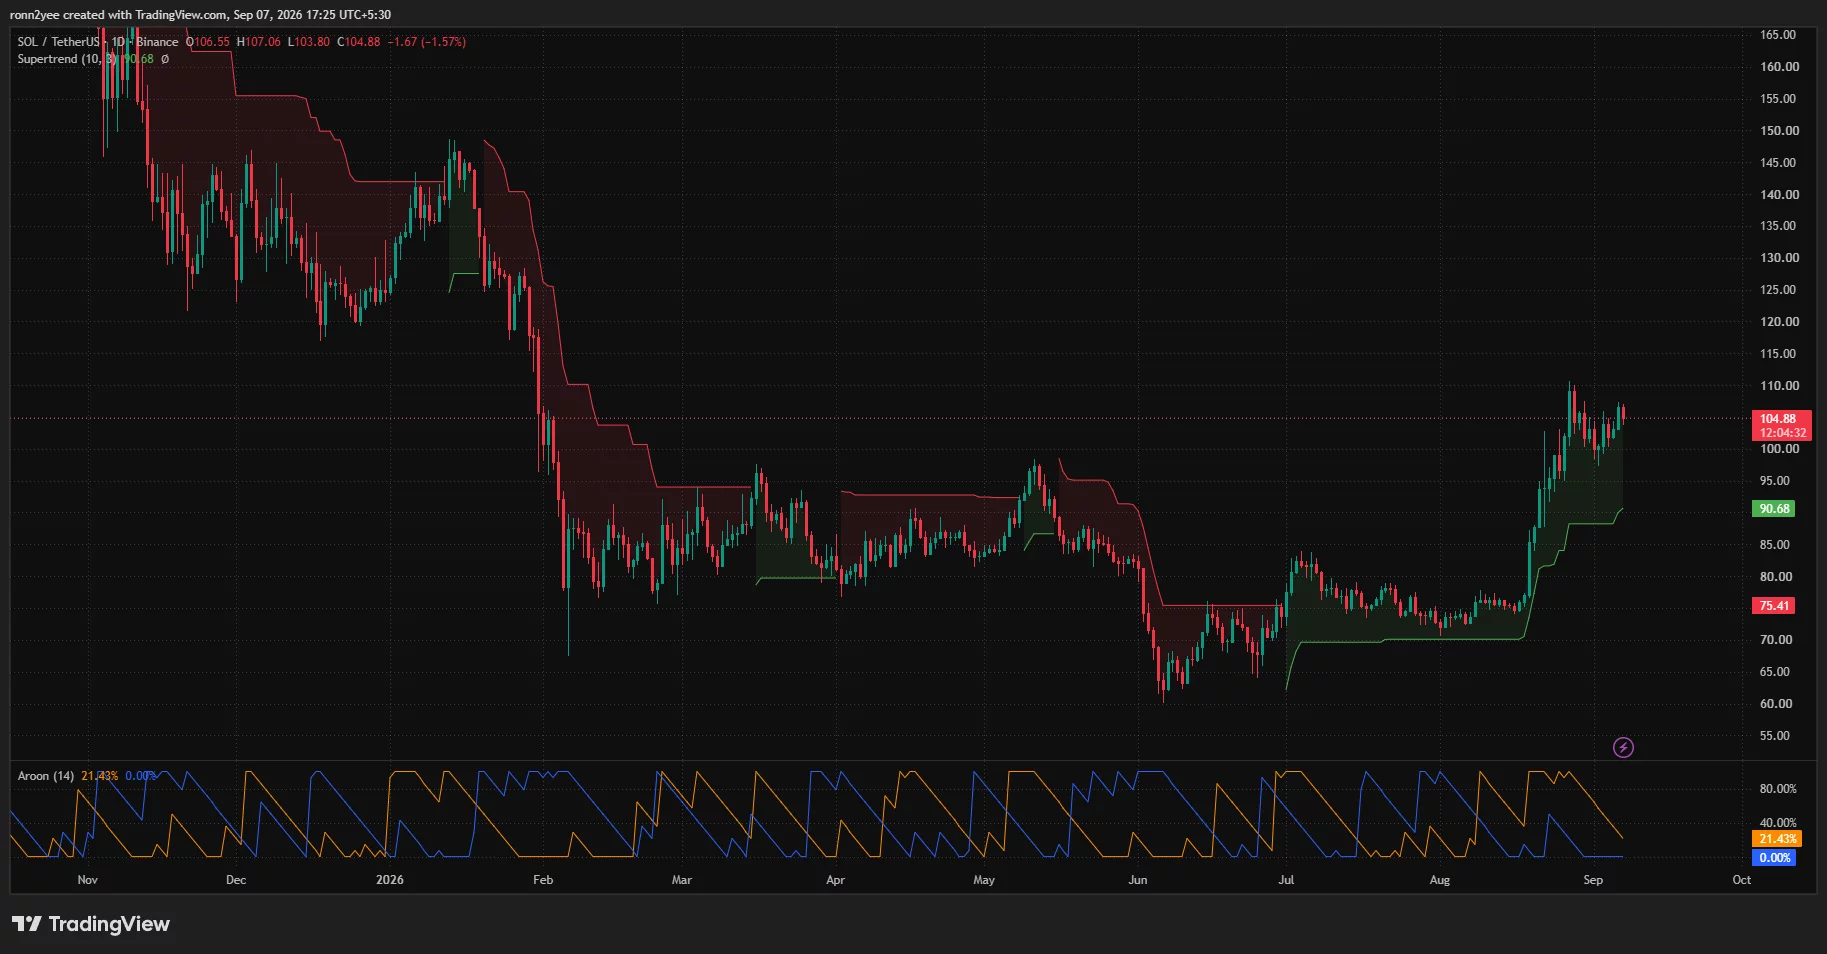
The daily chart presents a mixed outlook. Solana remains above its Supertrend support at $90.68, leaving the wider recovery structure intact despite the rejection from $109.
Aroon readings, however, show that near-term momentum has weakened. The Aroon Up indicator stands at 0%, while Aroon Down is at 21.43%. Neither reading signals a strong trend, but the lack of a recent high explains why buyers have struggled to extend the rally.
The chart places the next major Supertrend resistance near $110.68. SOL would need to close above that level to strengthen the bullish case and open a possible move into the $115 region.
A daily close below $100 would shift attention toward $95 and the Supertrend support near $90.68. That level also marks the point below which the broader bullish structure would face a more serious test.
Analysts see another Solana move developing
Analyst Wayne Liang said Solana could begin another upward leg after the token’s roughly 45% rally from an earlier buy signal near $75 to a sell signal around $109.
Liang said his indicator may be approaching another buy signal, although the chart had not confirmed one at the time of the post. The analyst’s view supports a possible continuation scenario but depends on SOL maintaining its rising trend structure.
Team LAMBO Charts separately described the $70–$95 range as an accumulation zone preceding an expansion phase. However, the post said SOL was already above $140, a figure that conflicts with both the attached chart and the observed market price near $105. The broader accumulation-to-expansion interpretation may still apply, but the stated price cannot be treated as current.
For US traders, expectations around Federal Reserve policy remain an external risk for SOL and other high-beta crypto assets. Higher-for-longer interest rates generally reduce demand for speculative assets, while any shift toward easier financial conditions could improve the backdrop for an upside breakout.
In the short term, $103–$104 is the main support zone, while $107–$108 remains the first barrier. Whichever side breaks first could determine whether SOL retests $110 or returns toward $100.
Disclosure: This article does not represent investment advice. The content and materials featured on this page are for educational purposes only.
